In applied thermodynamics, since the beginning, flow diagrams with directional lines having their thickness proportional to the quantity (mass, energy, heat, etc.) whose flow is being represented have being used. These flow diagrams are currently referred as Sankey’s Diagrams ([1]), so recalling the Irish Captain Matthew H. P. Riall Sankey ([2], [3], [4]) who in 1898 used this graphic representation to provide an impressive view of the energetic efficiency of a steam engine ([5]). Using his own words: “… the diagrams in Plate 5 have been prepared, which it is hoped may assist to a clearer understanding of the nature and extent of the various losses” (Figure 1).
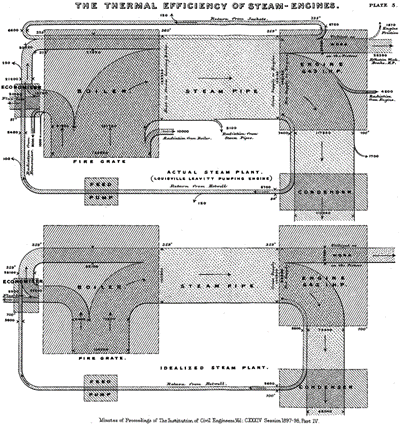
Figure 1 – Flow Diagram in Sankey’s paper of 1898 ([5])
However, Sankey was not the first to conceive that kind of diagram. The French civil engineer, Charles Joseph Minard ([6], [7]), in 1869 had the idea to use such a kind of graphical representation to provide at a glance the flow of the quantity he wanted to represent, specifically the reduction through the time of the number of soldiers of the Napoleon’s Great Army that was involved in the Russian Campaign in 1812-13, subject that is the narrative background of Tolstoy’s novel “War and Peace” ([9], [10]).
Indeed, Minard worked out on his first flow diagram since 1845 ([6]) to represent the public transportation travellers moving from Dijon to Mulhouse (Figure 2); whereas, his first statistical graphic was prepared since 1825. The Napoleon’s Russian campaign map (Figure 3) is considered the best map ever made ([9], [15], [22]) since, because of its descriptive efficacy ([15], [16]), it succeeds to concentrate in one page all essential information whose narration required hundred pages of the novel “War and Peace” ([10]).
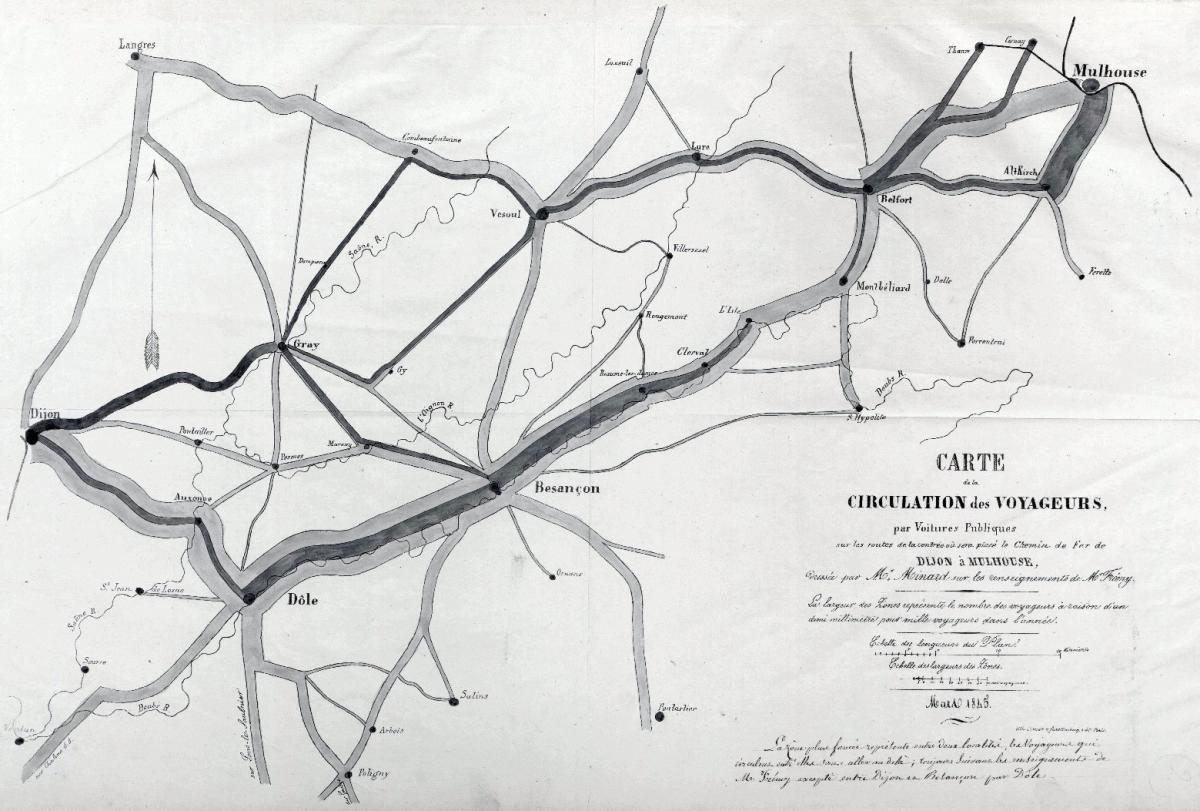
Figure 2 – Minard’s map of travelers circulating between Dijon and Mulhouse, 1845
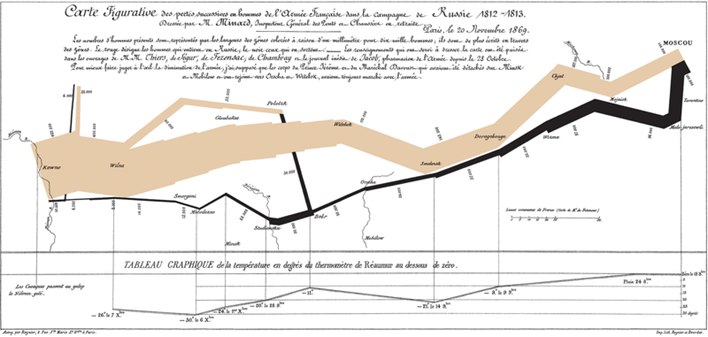
Figure 3 – Minard Map of Napoleon’s Russian campaign, 1812-13
Minard, even though his main employment was as civil engineer acting as Inspector (general) of the Corps of Bridges, field where he had a distinguished position, as it is proved by his works gathered at “Bibliothèque Numérique Patrimoine des Ponts”, where they can be view and downloaded ([11]), has greatly worked in the field of graphical information as it is shown by his book “Des Tableaux Graphiques et des Cartes Figuratives”, issued on 1862 ([8]). For his contributions, he is considered one of the fathers, maybe the father, of modern infographic ([26]). On this respect, of relevance are the studies on his activity carried out by Corbett ([12]), Friendly ([13], [14]), Rendgen ([15]), Robinson ([21]), Tufte ([18], [19], [20]), Wainer ([22]).
In spite of Minard’s primacy, the modern flow diagrams have taken their name by Sarkey who first used them to represent the energy transportation. The National Geographic devoted an article ([23]) to this aspect, with a title stating that Minard was underappreciated. However, considering the amount of papers dedicated to him, it is hard to state that he was an underappreciated fellow. It happens that today this kind of flow diagrams are almost exclusively used to represent energy flows, for that it is quite reasonable that they preserve the name of whom first used them for this scope, stimulating others to do the same, as the Thurston’s article of 1898 ([35]) proves.
The Sankey’s diagram (see Figure 1) was immediately appreciated and used. In a paper ([35]), published the same year (1898) of their introduction, Thurston wrote what follows: “… are illustrated by an exceedingly interesting and helpful diagram in which the energy-flow is traced from its source in the fire-box of the boiler through the boiler and its contents of steam and water, on the one hand, for use in the engine, and, on the other hand, to the chimney as a waste. ….”. At page 339 of his book ([36]) published on 1902, Thurston cites as “Sankey Diagram” the diagram providing the thermal energy distribution in an engine shown in figure 7 of his book (Figure 4 of this article). Probably the usage to denominate as Sankey’s diagrams these flow diagrams originated with this book.
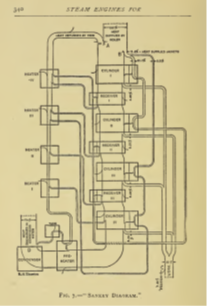
Figure 4 – Sankey’s Diagram shown in Thurston book ref. [35]
An ample discussion on the Sankey’s Diagrams can be found in the technical papers of the German professor Mario Schmidt ([33], [34]). These papers show several application examples of Sankey’s Diagram to energy and mass transfer in thermodynamic processes. Very interesting is also the rich bibliography of the paper [33].
The use of Sankey’s diagrams is largely consolidated everywhere. The statistical office of European Union, EUROSTAT (>>), has developed an informatic tool, available on their website, to generate and visualize the energy balances as Sankey’s diagrams ([37]). The EUROSTAT handbook “Sankey diagrams for energy balance” ([37]) refers to the Sankey’s paper of 1898 and to the figure 7 of 1902 Thurston’s book (>>). IEA (International Energy Agency), too, makes use of Sankey’s Diagrams for “Energy Balances” ([38]), as well as the US Energy Department does ([39]).
The Sankey’s Diagrams are, however, used also in fields other than energy, as there is a quantity whose flow needs to be visualized. A special application is given by ref. [41] showing the flow of school competences (college) through professional employment. The website [40] provides many examples of these diagrams, among which diagram “EU Food Flow 2011, wet mass (Mt)” is significant, as Figure 5 shows.
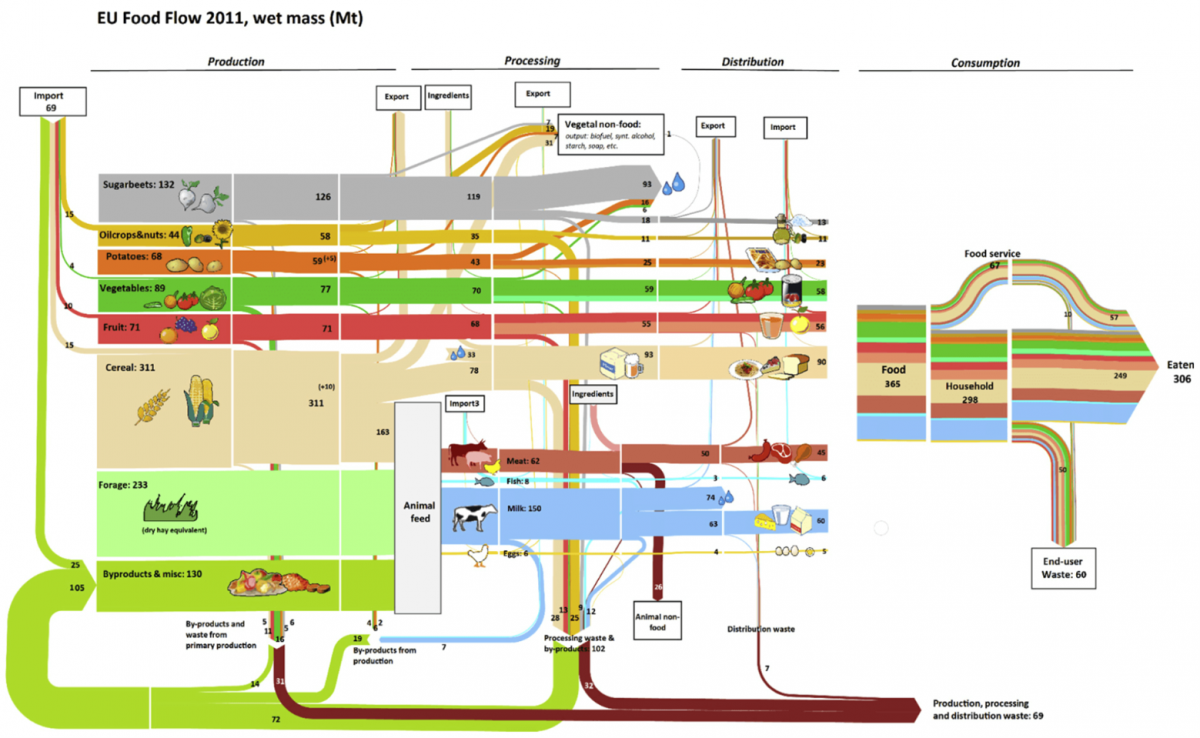
Figure 5 – European Union Food flow in 2011
Sun-Earth energy balance ([42]) is effectively represented by a Sankey’s Diagram ([42]) as Figure 6 shows, where the graph prepared by the author “Cmglee” is provided ([43]). This diagram has been generated with the tool SVG (Scalable Vector Graphics, [44]), using data from references [45], [46] and [47]. This Wikipedia link allows to visualize a vast assortment of Sankey’s Diagrams.
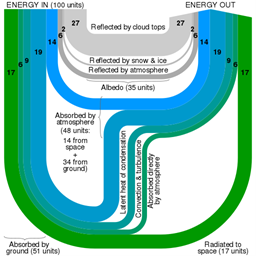
Figure 6 – Sun-Earth energy balance
The page “The Atmosphere’s Energy Budget” (>>), published on NASA (>>) website on January 14, 2009, makes use of Sankey’s Diagrams even to represent the green-house gas effect. The words “Sankey diagram” are however never used, so that searching the key-words “Sankey diagram” on NASA Earth Observatory (>>) website provides no outcome.
The Annual Energy Review (>>) by EIA (U.S. Energy Information Administration), currently replaced by the “Monthly Energy Review” (>>), makes use of Sankey’s diagrams as this link accessed on 2020-08-21 shows. Lawrence Livermore National Laboratory (LLNL), too, make use of Sankey’s diagrams to show energy consumption per sector of use (>>).
Using the designation “alluvial diagrams”, the Sankey’s Diagrams are used to graphically represent the changes in complex networks; for this reason they are used in studies of neuronal networks ([49]).
In the energy field, besides the Sankey’s diagramm, the Grassmann’s diagrams are used ([51], [52]), which are apparently identical but specialized in representing the exergy flow (maximum energy fraction that can be transformed in mechanical work with a reversible machine, [50]). References [53] and [54] provides examples of Grassmann’s or Sankey-Grassmann’s diagrams.
The market offers several tools to generate Sankey’s diagrams. The website dedicated to the Sankey’s diagrams ([55]) provides a wide collection of tools. What follows is the outcome of a more current (2020-08-21) research (>>).
|
1. |
e!Sankey 5 |
|
|
2. |
Sankey Flow Show |
|
|
3. |
Microsoft Power BI |
|
|
4. |
Tableau |
Sankey Charts in Tableau (>>); https://www.tableau.com/products + (>>); The Information Lab (>>) |
|
5. |
Qlik |
|
|
6. |
SDraw |
|
|
7. |
SB SankeyBuilder |
|
|
8. |
SankeyMatic |
|
|
9. |
Squish Logic Sankey Diagram |
|
|
10. |
ParallelSets |
|
|
11. |
MathWorks - drawSankey |
https://it.mathworks.com/matlabcentral/fileexchange/26573-drawsankey |
|
12. |
DISPLAYR |
|
|
13. |
Google Charts – Sankey Diagram |
https://developers.google.com/chart/interactive/docs/gallery/sankey |
|
14. |
The Sankey Diagram Generator |
|
|
15. |
InfoCaptor |
|
|
16. |
EUROSTAT Sankey Diagram Tool |
https://ec.europa.eu/eurostat/web/energy/energy-flow-diagrams |
|
17. |
IEA Sankey Diagram Interactive Tool |
Among the developers, it is reported that NDC Partnership (>>) developed the IEA tool, in addition to several Sankey’s diagrams applied in different fields.
References
[1] Wikipedia – Sankey diagram (>>) / Wikipedia – Diagramma di Sankey (>>) (accessed on 2020-08-19)
[2] Wikipedia – Matthew Henry Phineas Riall Sankey (>>)
[3] Institution of Mechanical Engineers – Past Presidents: 1920-21 Captain Matthew Henry Phineas Riall Sankey (>>) (accessed on 2020-08-19)
[4] Minutes of the Proceedings of the Institution of Civil Engineers – Obituary. Captain Matthew Henry Phineas Riall Sankey, 1853-1925 – Volume 221, Issue 1926, 1926, pp. 271-274 (>>)
[5] H. Riall Sankey – The Thermal Efficiency of Steam-Engines – report of the Committee appointed on the 31st March, 1896, to Consider and Report to the Council upon the Subject of the Definition of a Standard or Standards of Thermal Efficiency for Steam-Engines: with an Introductory Note – Minutes of the Proceedings of the Institution of Civil Engineers (ICE), Vol. 134, Issue 1898, 1898, pp. 278-312 (>>)
[6] Wikipedia – Charles Joseph Minard (>>) (accessed on 2020-08-19)
[7] Encyclopedia of Statistical Science – Minard, Charles Joseph – Published online 15 Aug. 2006 (>>)
[8] Minard, Charles Joseph – Des Tableaux Graphiques et des Cartes Figuratives – Thunot, 1862 (>>) (english version by Tufte >>)
[9] La Repubblica – Dentro la mappa di Guerra e Pace, di Giacomo Papi, 03 november 2012 (>>)
[10] Odifreddi, Piergiorgio – Guerra e pace, in breve – Il matematico impertinente, Le Scienze, July 2019 (>>)
[11] Bibliothèque Numérique Patrimoine des Ponts – Cartes et documents de Ch.-J. Minard (>>) (accessed on 2020-08-19)
[12] Corbett, John – Charles Joseph Minard: Mapping Napoleon’s March – 1861 – Center for Spatially Integrated Social Science.
[13] Friendly, Michael – Visions and Re-Visions of Charles Joseph Minard – Journal of Educational and Behavioral Statistics, Spring 2002, Vol. 27, No. 1, pp. 31-31 (>>)
[14] Friendly, Michael – The Graphic Works of Charles Joseph Minard – 08/19/2020, DataVis.ca (>>)
[15] Rendgen, Sandra – The Minard System – Visionscarto, 16 October 2018 (>>) (>>)
[16] Blog: From numbers to graphics – Charles-Joseph Minard’s map of Napoleon’s flawed Russian campaign: An ever-current classic – Sara Brinch, 22 mars 2019 (>>)
[17] Minard’s Chart of Napoleon’s Campaign (>>)
[18] Minard's Sources— from Virginia Tufte and Dawn Finley, August 7, 2002 (>>)
[19] Tufte, Edward R. – The Visual Display of Quantitative Information, Second Edition – Graphics Press, Cheshire, Connecticut, 2001 (>>)
[20] Tufte, Edward R. – Poster: Napoleon’s March (>>) (accessed on 2020-08-19)
[21] Robinson, Arthur H. "The thematic maps of Charles Joseph Minard." Imago Mundi 21 (1967): 95-108. (>>)
[22] Wainer, Howard. "Visual Revelations: A Graphical Legacy of Charles Joseph Minard: Two Jewels from the Past." Chance 16.1 (2003): 58-62. (>>)
[23] National Geographic – The Underappreciated Man Behind the “Best Graphic Ever Produced”, by Betsy Mason – March 16, 2017 (>>)
[24] Info We Trust – Seeking Minard – March 15, 2017 (>>)
[25] Info We Trust – Finding Minard – March 16, 2017 (>>)
[26] Wikipedia – Infografica (>>) / Infographic (>>) (accessed on 2020-08-21)
[27] Sankey, H. R. – The Thermal Efficiency of Steam-Engines – Naval Engineers Journal (NEJ), Volume 11, issue 4, November 1899, Pages 949-975 (>>)
[28] Sankey, H. R. - The Maps of the Ordnance Survey: a mid-Victorian view. Originally published in 1888 in Engineering, a weekly illustrated journal - Charles Close Society London – Republished in 1995. (>>)
[29] Sankey, H. Riall – The Energy Chart, Practical Applications to Reciprocating Steam-Engines – Albert Frost and Sons, Rugby, 1905 (>>)
[30] Sankey, H. R. – Explosives, their use for Military Engineering Land Operations and Electrical Measurements – Kingston, 1882 (>>)
[31] Sankey, H. R. and Walker, G. R. – Guide to the course of military engineering at the Royal Military College of Canada – Kingston, 1883 (>>)
[32] Marshall, William J and Sankey, Matthew H.P.R. – Gas Engines – Constable limited, 1911 (>>)
[33] Schmidt, Mario – Der Einsatz von Sankey-Diagrammen im Stoffstrommanagement – Nr. 124, Beiträge der Hochschule Pforzheim, 2006 (>>)
[34] Schmidt, Mario – The Sankey Diagram in Energy and Material Flow Management, Part I: History – Journal of Industrial Ecology, Volume 12, Number 1, 2008 (>>)
[35] Thurston, R. H. – Thermal Efficiency of Steam-Engines – American Association for the Advancement of Science, Vol. 8 No. 205 (Dec. 2, 1898), pp. 754-768 (>>)
[36] Thurston, Robert H. – Stationary Steam Engines, Simple and Compound, Especially as Adapted to Light and Power Plants – Seventh Edition, New York, John Wiley and Sons, 1902 (>>)
[37] EUROSTAT – Sankey diagrams for energy balance – Statistics explained – 17/04/2020 (>>)
[38] IEA – World Balance (2017) (>>)
[39] Office of Energy Efficiency & Renewable Energy – Dynamic Manufacturing Energy Sankey Tool (2010, Units: Trillion BTU) (>>)
[40] Site www.sankey-diagrams.com
[41] Schmidt, Ben – What are you going to do with that degree? (>>)
[42] Wikipedia – Bilancio energetico Sole-Terra (>>) / Earth’s energy budget (>>) (accessed on 2020-08-21)
[43] Wikipedia – File: Earth heat balance Sankey.svg
(https://en.wikipedia.org/wiki/File:Earth_heat_balance_Sankey_diagram.svg) (accessed on 2020-08-21)
[44] Wikipedia – Scalable Vector Graphics (>>) (accessed on 2020-08-21)
[45] Reddy, S.M. Editor – University Botany II: (Gymnosperms, Plant Anatomy, Genetics, Ecology), Volume 2 – New Age International (P) Limited, Publishers, 2003 (>>)
[46] Sharma, P.D. – Environmental Biology – Fourth Reprint (Second Edition), 2008 (>>)
[47] Sharma, P.D. – Environmental Biology and Toxicology - Fourth Reprint (Second Edition), 2008 (>>)
[48] Wikipedia – Schema alluvionale (>>) / Alluvial Diagram (>>) (accessed on 2020-08-21)
[49] Rosvall, M. and Bergstrom, C.T. – Mapping Change in Large Networks – PloS One, January 27, 2010 (>>)
[50] Wikipedia – Exergia (>>) / Exergy (>>) (accessed on 2020-08-21)
[51] Grassmann Diagrams – Sankey Diagrams, July 3, 2007 (>>)
[52] Carrero, M.M., De Paepe, W, Bram, S. and Contino, F. – Thermodynamic analysis of water injection in a micro gas turbine: Sankey and Grassmann diagrams – The 8th International Conference on Applied Energy – ICAE2016 (>>)
[53] Hinderink, A.P., van der Kool, H.J. and de Swaan Arons, J. – On the efficiency and sustainability of the process industry – Green Chemistry, Vol. 1, Issue 6, 1999 (>>)
[54] Wall, G. and Gong, M. - On Exergetics Economics and Desalination – Thermal Power Plant and Co-Generation Planning, Vol. III, 1997 (>>)
[55] Sankey Diagram Software – Sankey-Diagrams. Com – May 7, 2007 (>>)


Add new comment